Graphics Module
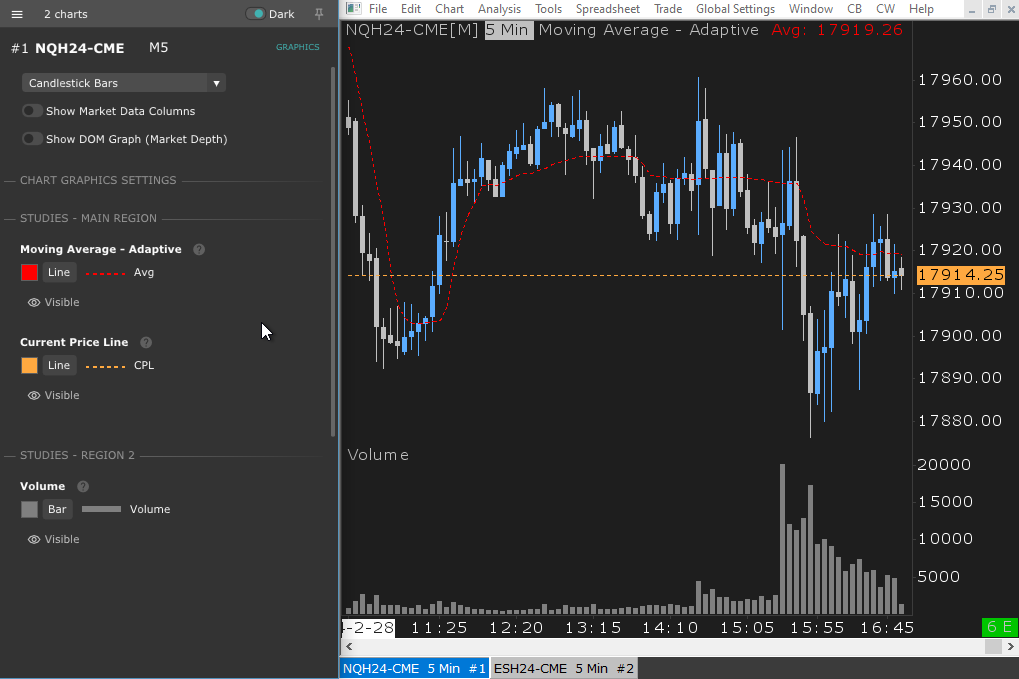
The Graphics Module allows adjusting the graphics settings of every chart and study very quickly. See Main Screen for a description of the common features (header).
Chart Draw Style
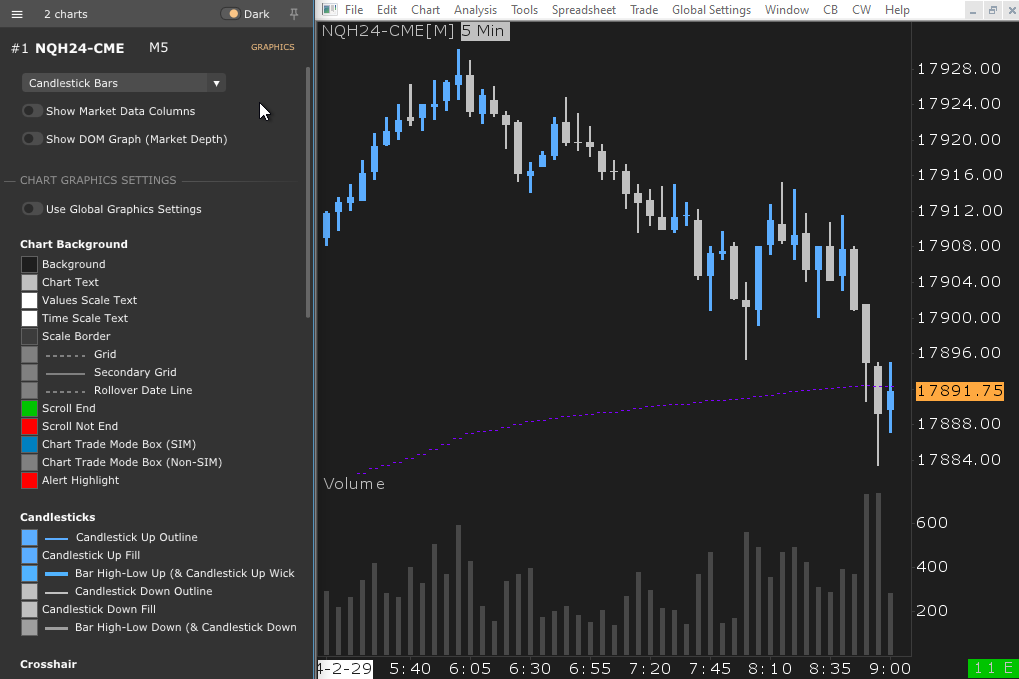
Renko and Point and Figures require to set a specific Bar Period. This may be handled in a future release.
See here for adjusting the Bar Period.
Chart Graphics Settings
The 144 Chart Graphics Settings are grouped by topic. Each group can be :
- toggled open/close (left click, no change on the chart)
- copied to other charts (right click)
Available pickers : Color Picker, Line Style and Line Width Picker.
A few Graphics Settings also have a ‘Show/Hide’ switch. For example Last Trade Price Box Settings.
Set Chart Graphics Settings
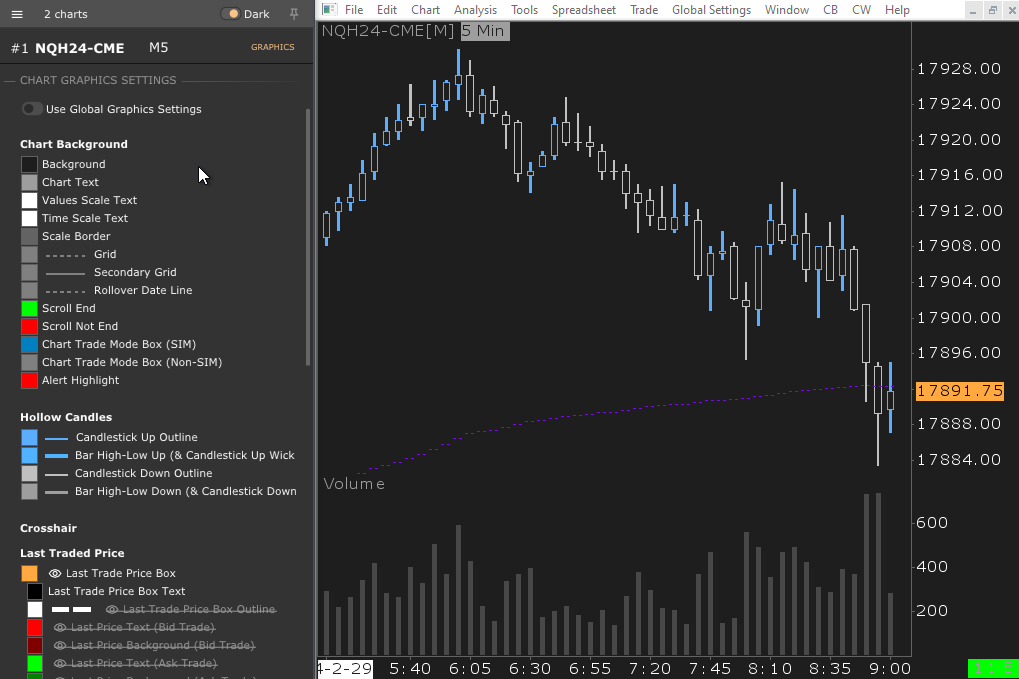
Apply Graphics Settings to other charts (right click)
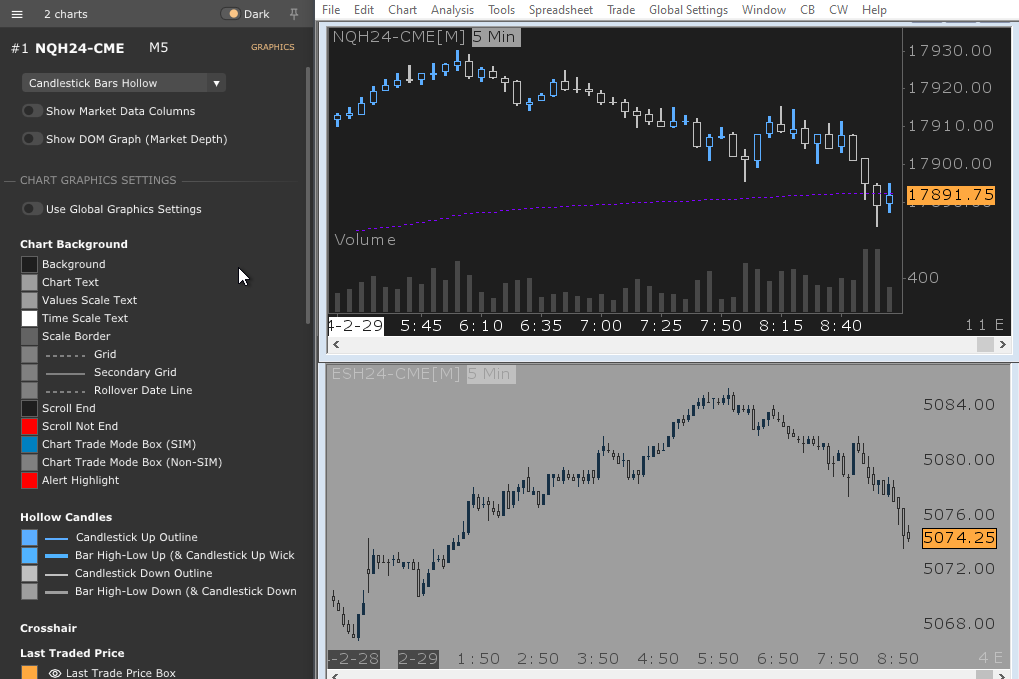
Study Graphics Settings
The available pickers are Subgraph Draw Style Picker, Color Picker, Line Style Picker and Line Width Picker.
The 107 Subgraph Draw Style options are grouped by family.
Styles with transparency are displayed with a blur icon : 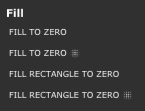
There are also direct controls for changing Study Transparency and Study Visibility.
The question mark is a clickable link to the study documentation on Sierra Chart website : 
Set study subgraph
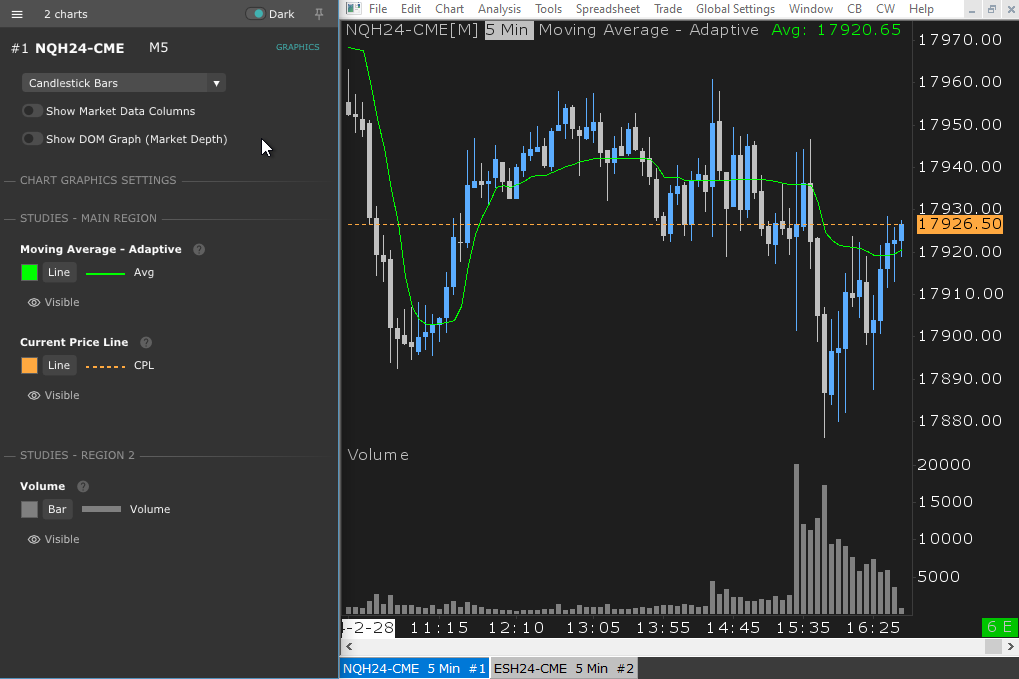
Please note that the effect of changing a subgraph style depends on each study. Refer to the study documentation for more information.
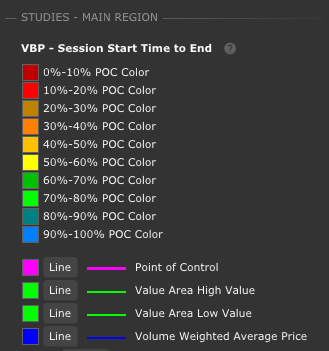
Some Sierra Chart studies also contain inputs of type Color, for example Volume By Price :
Apply study subgraphs to other studies of the same type
